Keep only closed bars
Every scale is asked at its own candle close, and a bar is stored once it can no longer change. Nothing provisional reaches the count.

Current regime, momentum horizons, universe alignment and the cleanest confirmed-pivot structures.
Connecting to Binance and Yahoo Finance…
Elliott Wave is the only widely used framework that maps trend, correction, degree, targets and invalidation in one coherent model. The difficult part is maintaining a valid multi-degree count as new pivots arrive. That is what Sir Elliott automates.
Candles are collected at every close. The count itself is re-read once a day, whole, against the reading that came before — so it moves when the structure moved, not with the noise.
Every scale is asked at its own candle close, and a bar is stored once it can no longer change. Nothing provisional reaches the count.
A volatility-scaled ZigZag with a fixed threshold per scale turns candles into pivots, the same way on a quiet week and a wild one.
Once a day the model reads all four scales together against the accepted count, keeps what still fits, and records a new revision.
Navigate Cycle, Primary, Intermediate and Minor counts without detaching the local setup from its parent structure.
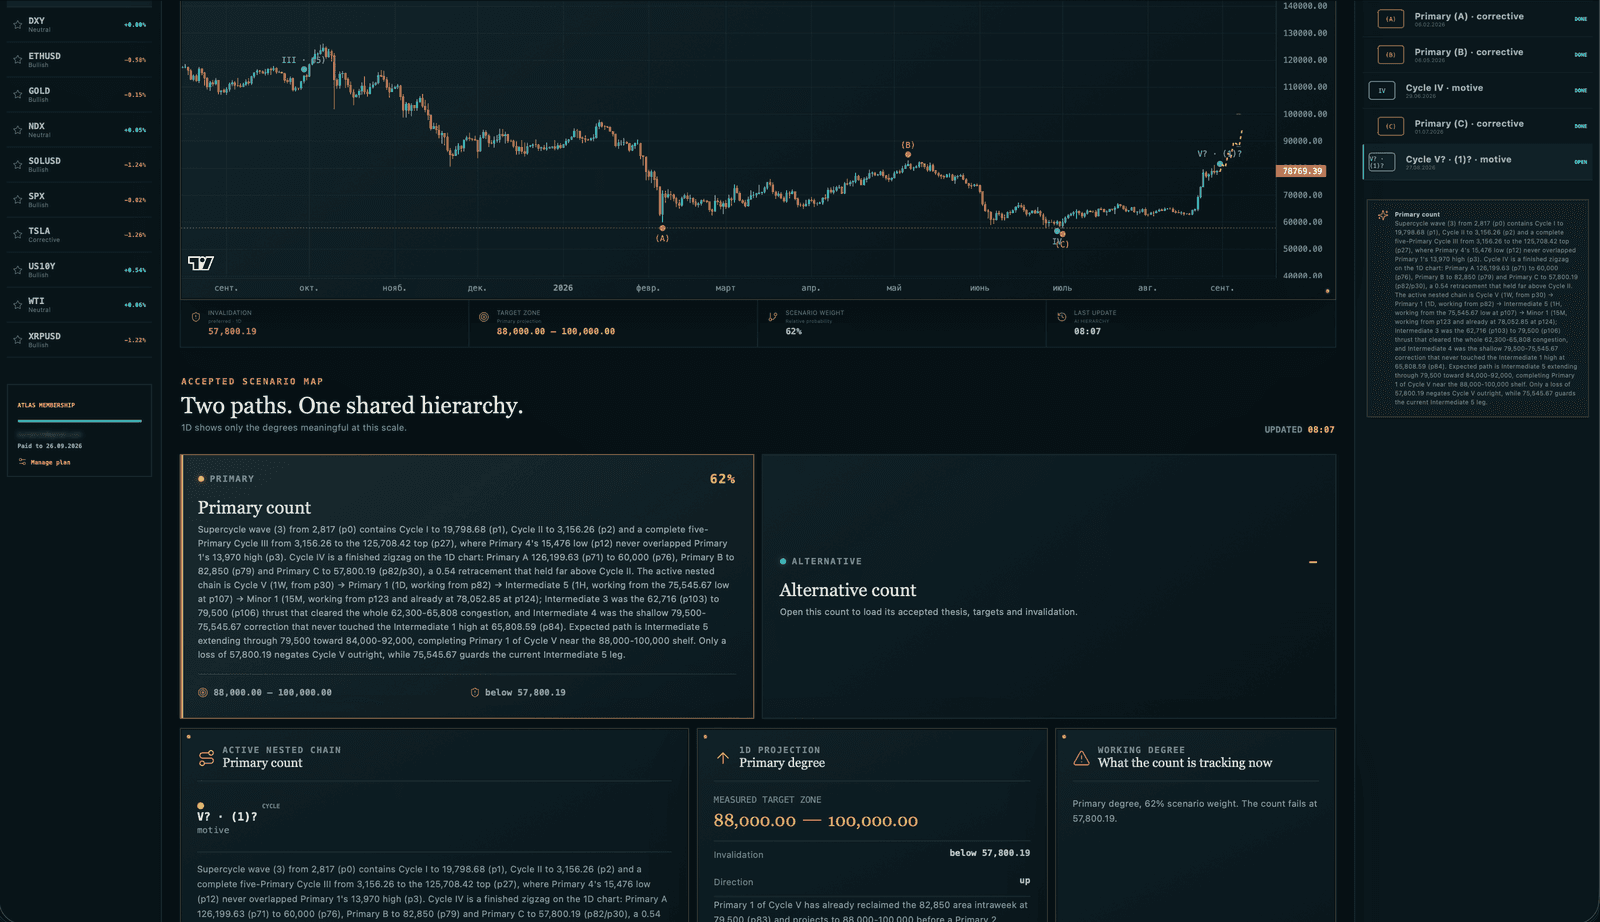
Every count carries its target zone and the price that invalidates it, so what you watch is a level on the chart rather than the noise around it.
Compare the exact count before and after each reading, including the reason the update was accepted.
The public atlas shows higher-degree context. A membership opens the structure required to plan and invalidate an actual market thesis.